Automated Report

Deskroom provides an automated report feature that organizes and presents your data by the criteria you want. Without complex filtering or manual work, you can review the structured data at once and quickly gain the insights you need.
Why we made this
When creating materials for internal sharing, you often need to break down and review data by various criteria such as brand, channel, and product.
For example, you might need to understand product claim status by country over a specific period. Or you might want to organize the number of inquiries and an issue summary by channel and share it with your team.
So that you can gather and report data combining multiple criteria at once, Deskroom provides the automated report feature. It reduces the time spent creating reports and helps you make accurate decisions.
Use cases
When you want to organize product claim issues by country
A CX team member, for the "product claim" type,
- sets country, product name, and question type as criteria
- with the number of tickets per item and a summary of the issue details
By setting up the criteria this way, a report organizing the related issues is generated automatically. You can grasp the status at a glance without any separate editing and share it with your team right away.
When you want to monitor the early reactions to a newly launched product
To check the early VOC for a recently released product,
- based on data from the last two weeks
- set brand, product name, and question type
- and generate a report that includes a summary of customer feedback
Through this, you can quickly capture customer reactions to the new product and make the decisions needed to improve operations swiftly.
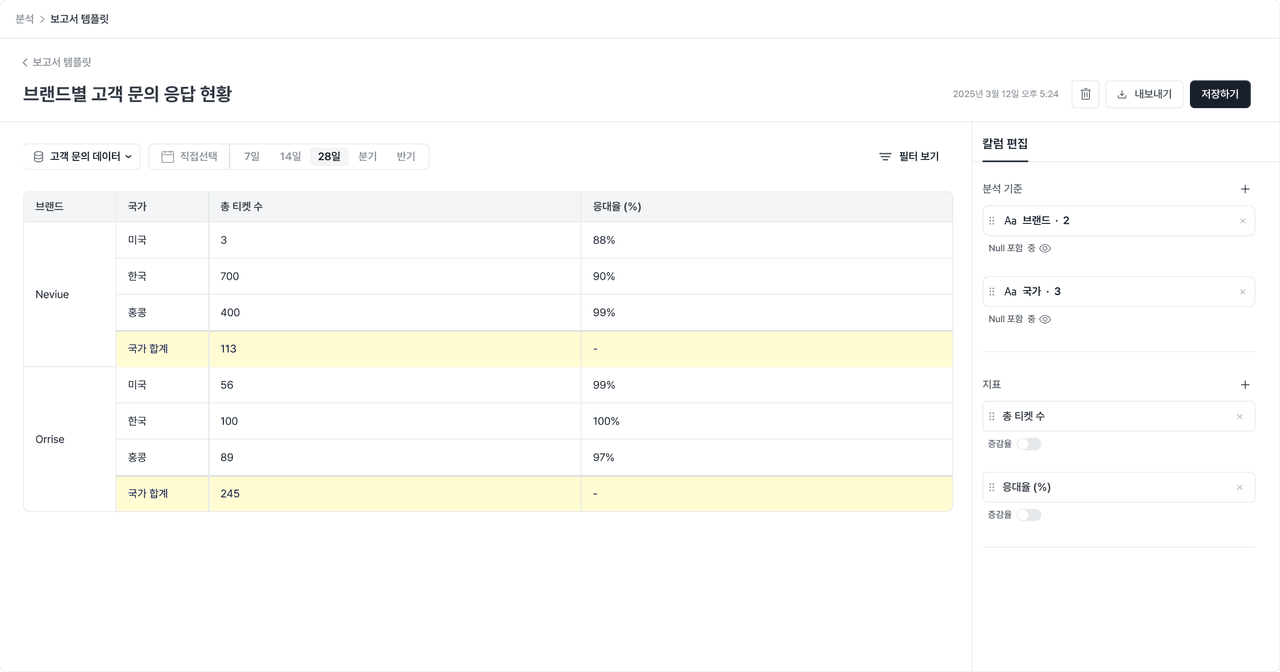
How to use
Go to Deskroom's [Report] tab to generate a report. Once you select the analysis criteria and metrics you want, a report that matches the conditions is automatically generated in table form.
You can create the materials you need faster and more efficiently, without complex editing.