Changelog
See the latest features and improvements in Deskroom.
Agent Conversation Folders and Shared Conversations

Organize conversations into folders by work unit, and place the conversations you need in a shared space your whole organization can view.
Update: Chart Analysis Agent

Press the agent analysis button on a chart and the context of the chart you are viewing is passed automatically, so you can ask right there.
Update: Add Instances via File Upload

Upload multiple files at once—not just Excel and CSV but also JSON, DOCX, PDF, and PPTX—to turn them into instance candidates that you can review and register.
Update: Agent File Upload and Usability Improvements

Upload files right in the chat window to continue your analysis, and enjoy a more consistent sidebar and analysis result screen.
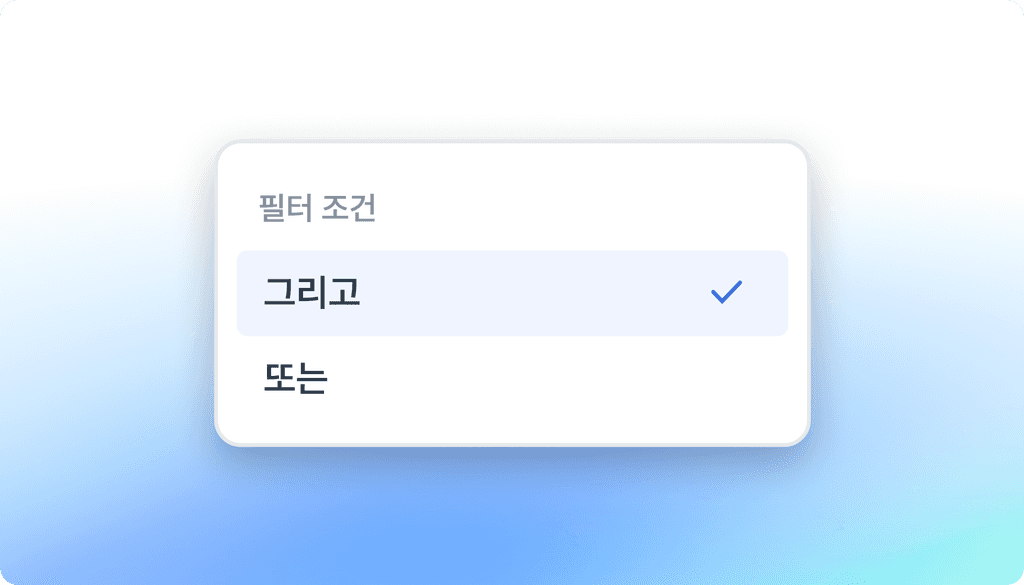
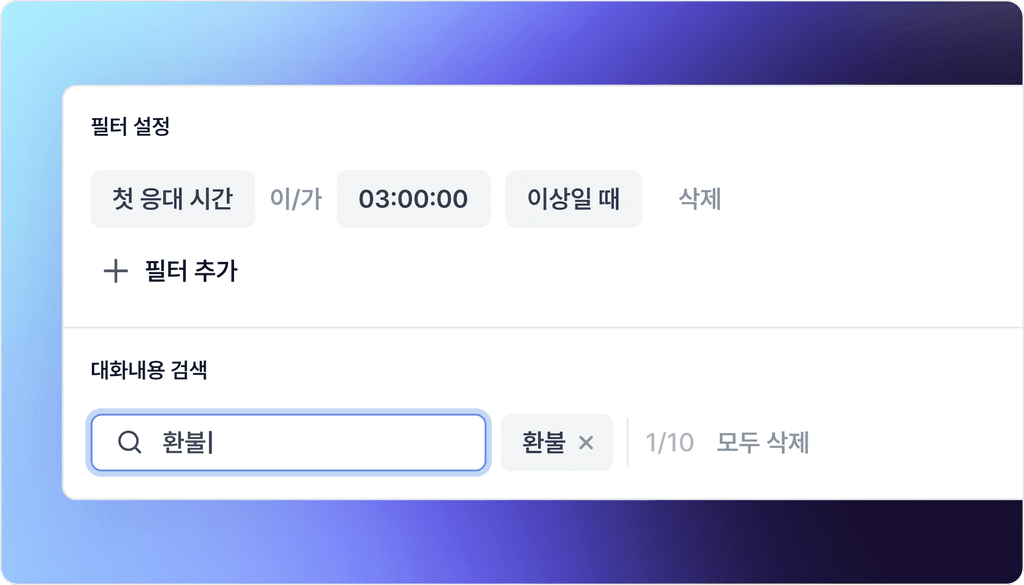
Update: Direct-Input Filter for Text Properties

Filter free-text properties by directly typing the words or phrases you want instead of using a value list, and quickly refine results with multiple values and operators.
Update: Feedback Daily Chart

Review feedback as a distribution along the time axis, narrow it down by your desired range and properties, and check detailed feedback right away.
Update: Freeform Dashboard

Arrange multiple charts freely on one screen, and narrow them all down at once under the same condition with a property filter.
Update: Derived Metrics, Hourly Trend Analysis, Resource History Tracking

We added creating derived metrics by combining existing metrics, hourly trend analysis, and tracking resource creation and edit history.
Update: AI Metric Creation and Filter Search

Describe a metric in natural language and it is generated automatically, and enter search conditions in natural language to set filters automatically.
Update: Ontology (Orders, Customers, Inquiries)

A segment concept has been introduced to order and customer analysis, and aggregation method management for grouping inquiry data by the criteria you want has been added.
Update: Usability improvements

We improved usability across analysis and search, including property value distribution views, trend row and column flipping, and object hierarchy representation.
Update: Export, Batch Apply, and Auto Sync

Include images in Excel exports, expand AI test instances to 50, and automate upstream sync.
Update: Edit Request Notifications and Filter Summary

Check the approval or rejection results of edit requests right away as notifications, even from external partner accounts, and see the applied conditions at a glance even when filters are collapsed.
Update: Translation and Property Sync

Read foreign-language posts translated right inside Deskroom, and auto-fill property values from external channels with a single sync button.
Research Preview: Agent

We released an AI agent that analyzes ontology data, identifies root causes, and suggests improvement options as a Research Preview.
Update: Property Filters

You can now apply functions to properties, compare two properties, and bookmark frequently used filter values.
Update: Ontology

We added percentile calculations and metric condition filters so you can define more precise, context-aware metrics.
Update: Edit Requests

Anyone can leave feedback on AI analysis results, and only the feedback an owner reviews and approves is reflected in training.
Update: Usability Improvements

We improved dashboard usability with simultaneous display of metrics in different units, editing type value names, and sorting by text and time.
Update: Usability improvements

We improved features for a more convenient experience, including per-metric chart views, direct date entry, and property list downloads.
Update: Permission Management

On top of organization-wide role-based permissions, you can now set access permissions granularly at the dashboard and view level.
Update: Property Management

Deactivate property values, show or hide properties, and respond flexibly to changes in your classification system.
Update: Metric Deep Dive

Set up a property hierarchy to drill down into metrics by detailed type, and see the composition at a glance with a Stacked Chart.
Update: Property Groups

Bundle multiple properties into groups that fit your purpose and arrange their order, so you can understand the view screen at a glance.
Update: Folders

Group your growing dashboards into purpose-based folders and structure them by adjusting the order with drag and drop.
Update: Target Metric Setting

Set a target value for each metric, and check where your current performance stands against the target with a target line on the chart.
Update: AI Feedback and Custom Prompts

Leave feedback for the AI within your everyday workflow, and write your own prompts to set its judgment criteria.
AI Summary

AI analyzes the conversations in your data so you can see the key topics at a glance and jump straight from each summary item to the details.
Community Search Keyword Settings

Register the keywords you want, and posts and comments containing those keywords are automatically collected and analyzed.
Summary Dashboard

Automatically aggregate representative values such as totals, averages, and proportions for a given period to use in report writing and performance reviews.
Trend Dashboard

Split data by property or keyword to quickly spot trends over time, outliers, and inflection points.
Overview Dashboard

Check key metrics and rankings at a glance to catch warning signs early and quickly identify the issues that need a response.
SLA Criteria Settings

Create SLA rules from ticket conditions and automatically determine compliance and non-compliance to accurately measure support performance.
Schedule Creation

Visualize the operating hours and break times for each support channel, and analyze response rates accurately based on actual service hours.
Custom Overview

Gather the key metrics you check often and the VOC types that recently occurred onto a single screen for a quick review.
Automated Report

Data is automatically organized by the criteria you want, so you can review structured data at once without complex filtering or manual work.
Custom View

Save the filters and metric configurations you view often and load them instantly with a single click.
Custom Metrics

Set up the conditions, channels, and types that differ for each organization to compose exactly the metrics you want with just a few clicks.
Filter Groups
Apply various conditions to number, text, and category values and bundle multiple conditions together to easily find the data you want to analyze.
Utterance Interval Metrics

We provide utterance interval metrics between customers and agents so you can grasp the support flow in fine-grained time units.
Salesforce Integration

Distill only the core insights you need for decision-making from complex Salesforce data to quickly diagnose your customer experience.
Internal Database Integration

Connect customer inquiries with internal business data to turn simple feedback into meaningful insights.
Naver Smartstore Integration

Automatically collect and refine the customer inquiries that accumulate in Smartstore, and analyze VOC and inbound trends as metrics.
Customizable Sentiment Analysis Criteria
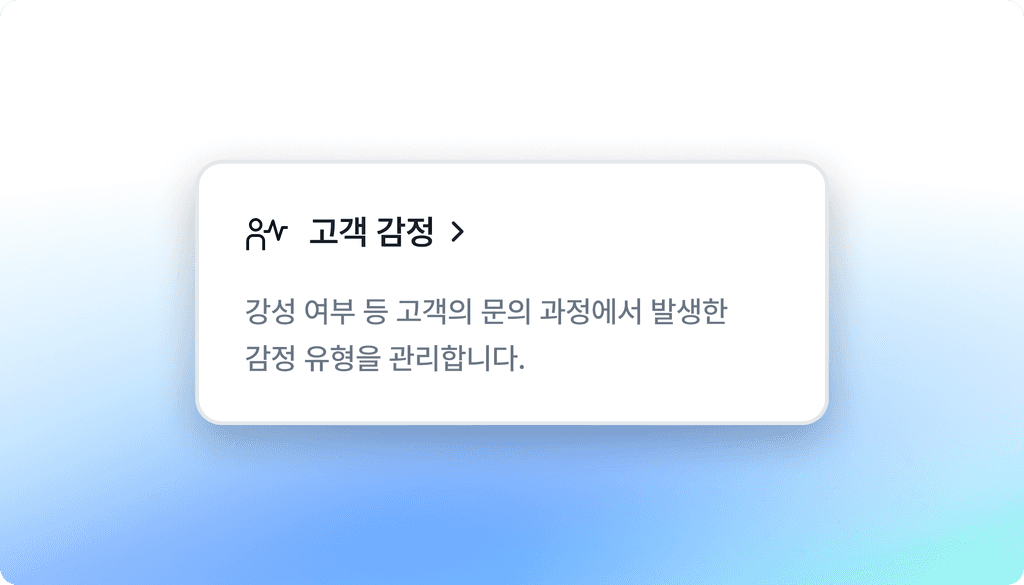
Train Deskroom AI yourself so that it interprets customer emotions the way your organization does.
Customizable Quality Assurance Criteria
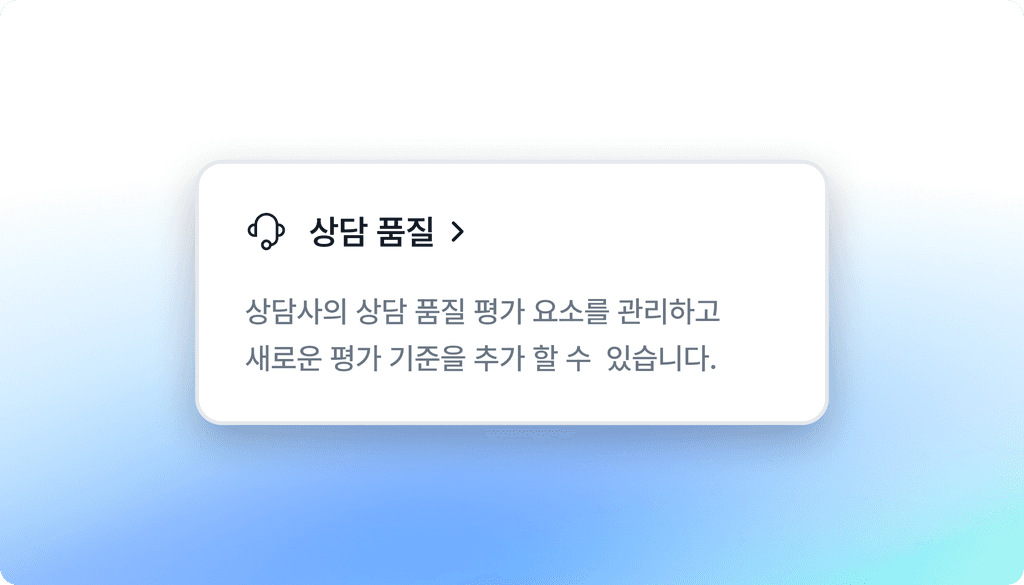
Assess support quality based on the criteria each organization defines itself and apply the results directly to training and operations.
Customizing VOC Analysis Criteria
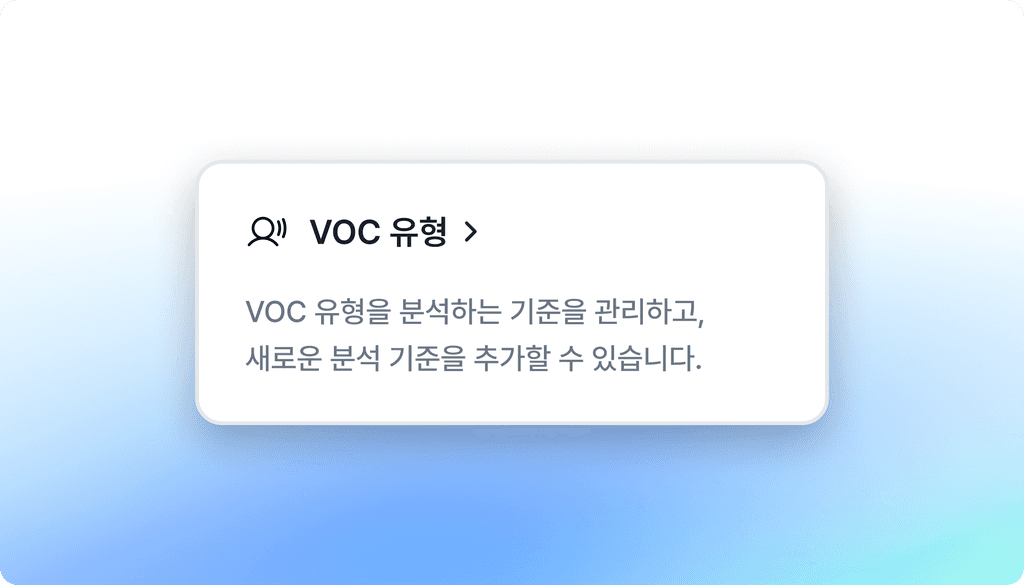
You can train Deskroom AI directly so that VOC can be analyzed by your company's own criteria.
Opening Agent and Closing Agent Analysis

Analyze whether the agent who first started a support session handed the ticket off to another agent during the conversation.
Community Analysis

Quantitatively analyze customers' unfiltered, true feelings from communities—feelings that do not surface in customer support or reviews.
Review Analysis

Quantitatively analyze recurring complaints and praise in customer reviews, and put them straight to work for product improvement and marketing strategy.
CSAT Analysis
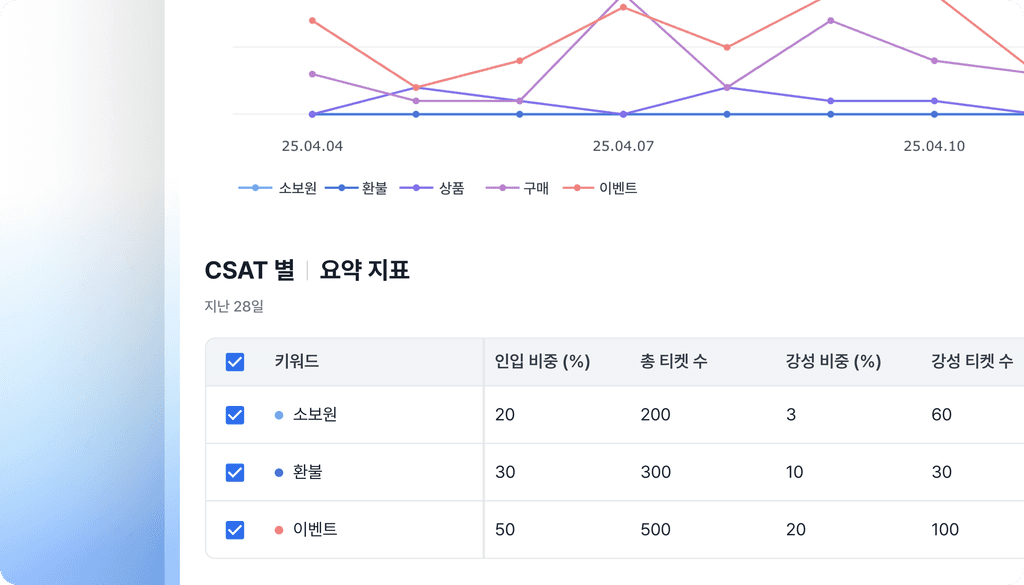
Match CSAT scores collected from multiple solutions to tickets and analyze the factors that had the greatest impact on customer satisfaction.
Download Analysis Results

Set your desired period and filters, then download the analysis results instantly with a single click.
Phone Support Solution Integration

Convert phone support data, a major part of customer support, into text so you can analyze everything from VOC to support quality.
Rate of Change Analysis

Analyze DoD, WoW, MoM, QoQ, and custom-period rates of change with a single button click.
Type Filter
Pick only the support types you want to look at and analyze them faster.
Inbound Sentiment Analysis
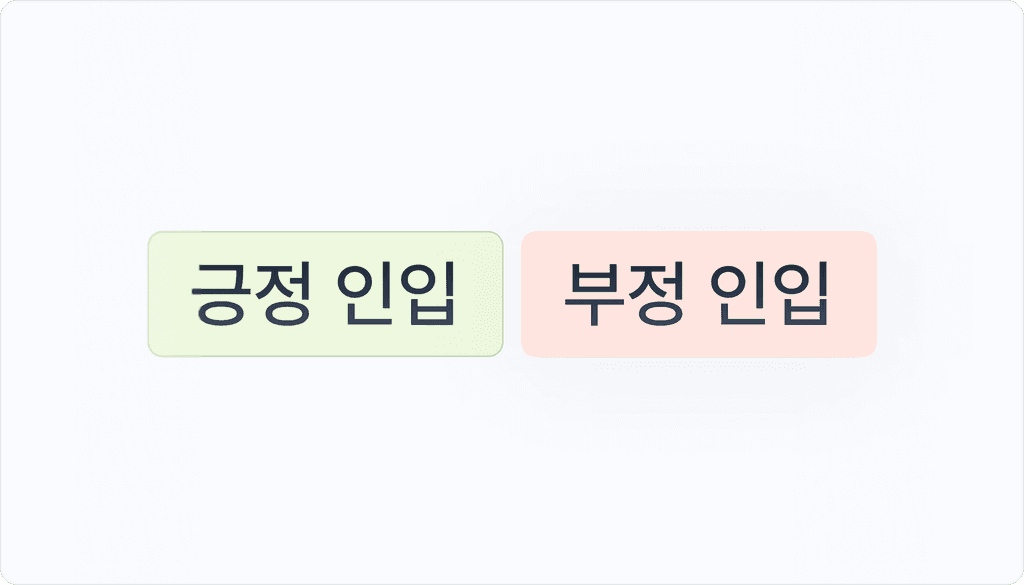
Automatically detect the customer's sentiment at the moment they submit an inquiry and check it as a quantified metric.
Closing Sentiment Analysis
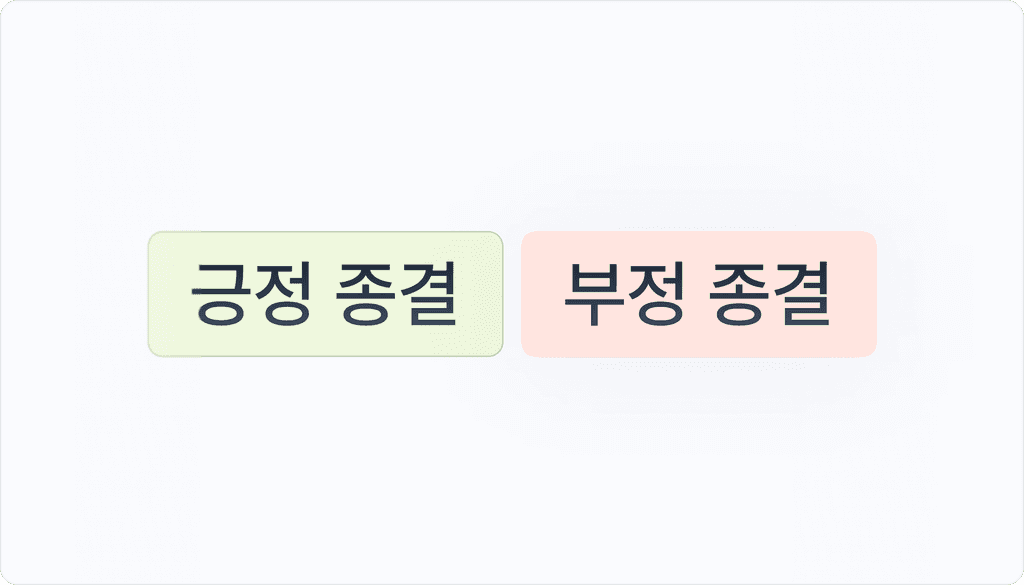
Automatically check how a support session wrapped up, including the customer sentiment at the moment of closing.
Support Conversation Summary
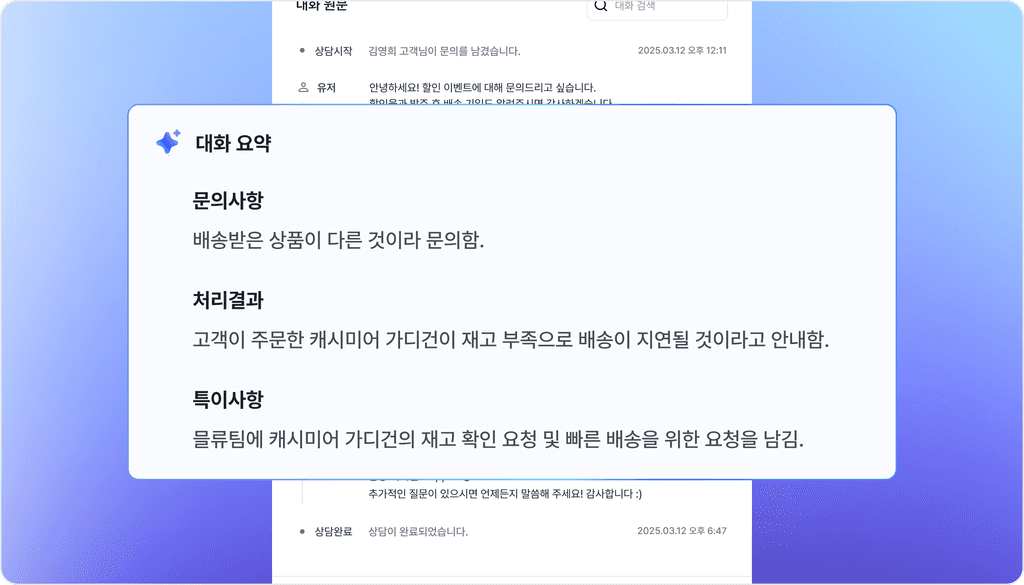
Quickly grasp the essentials and share them easily, without reading through every single support record one by one.
Toxicity Analysis
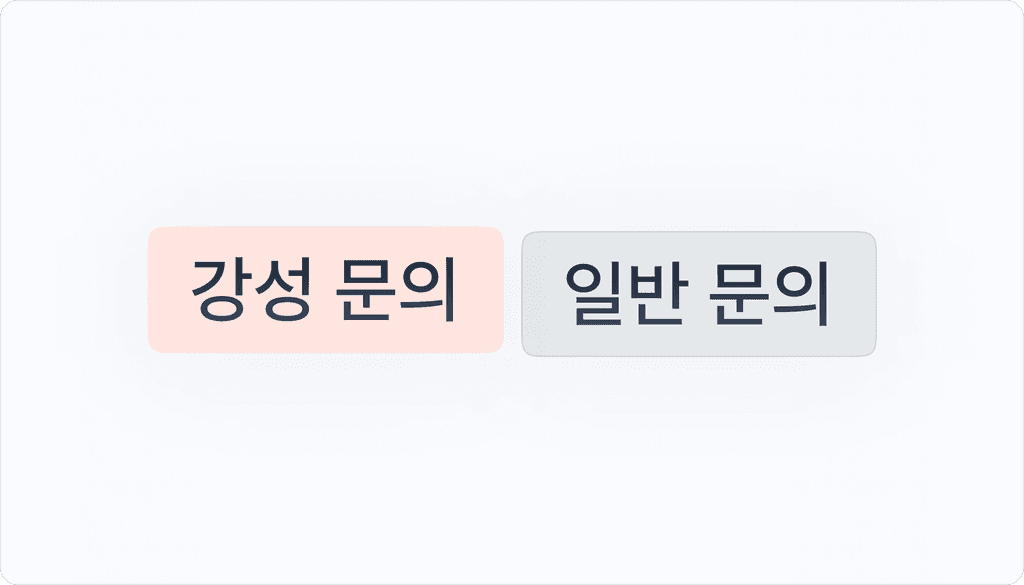
Quickly catch signals from toxic customers, such as profanity, mockery, and threats to report, and automatically classify tickets as toxic.
Zendesk integration
Analyze your Zendesk data directly in Deskroom, with no separate consultation or meeting required.
While AI does the work,
focus on what matters most
AI gathers your data,
analyzes it, and handles routine work.
See how it fits your company
with a free consultation.