Overview Dashboard

Deskroom's custom dashboard has been updated. Expanding one step beyond the existing custom dashboard feature, it can now handle not only VOC data but also a wide range of metrics such as transactions and advertising.
The first feature of the new custom dashboard is the [Overview Dashboard]. Check key metrics and rankings at a glance to catch warning signs early and quickly identify the issues that need a response right now.
Why we made this
To review operations every day, you have to download the data you need and re-select and organize the metrics you want each time. Calculating key metrics by hand or separately compiling the spike rankings takes a lot of time and resources, and sometimes you end up missing something important.
Deskroom automates this process.
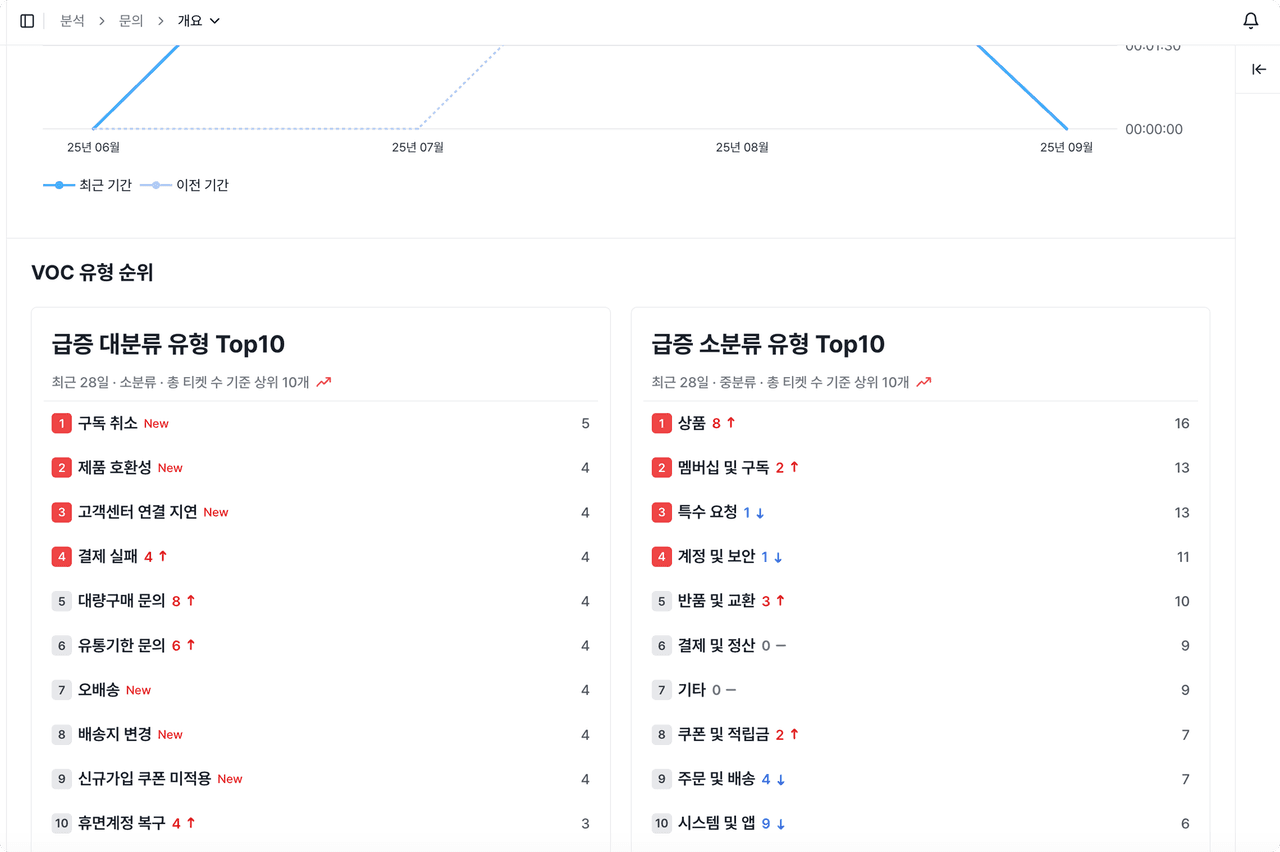
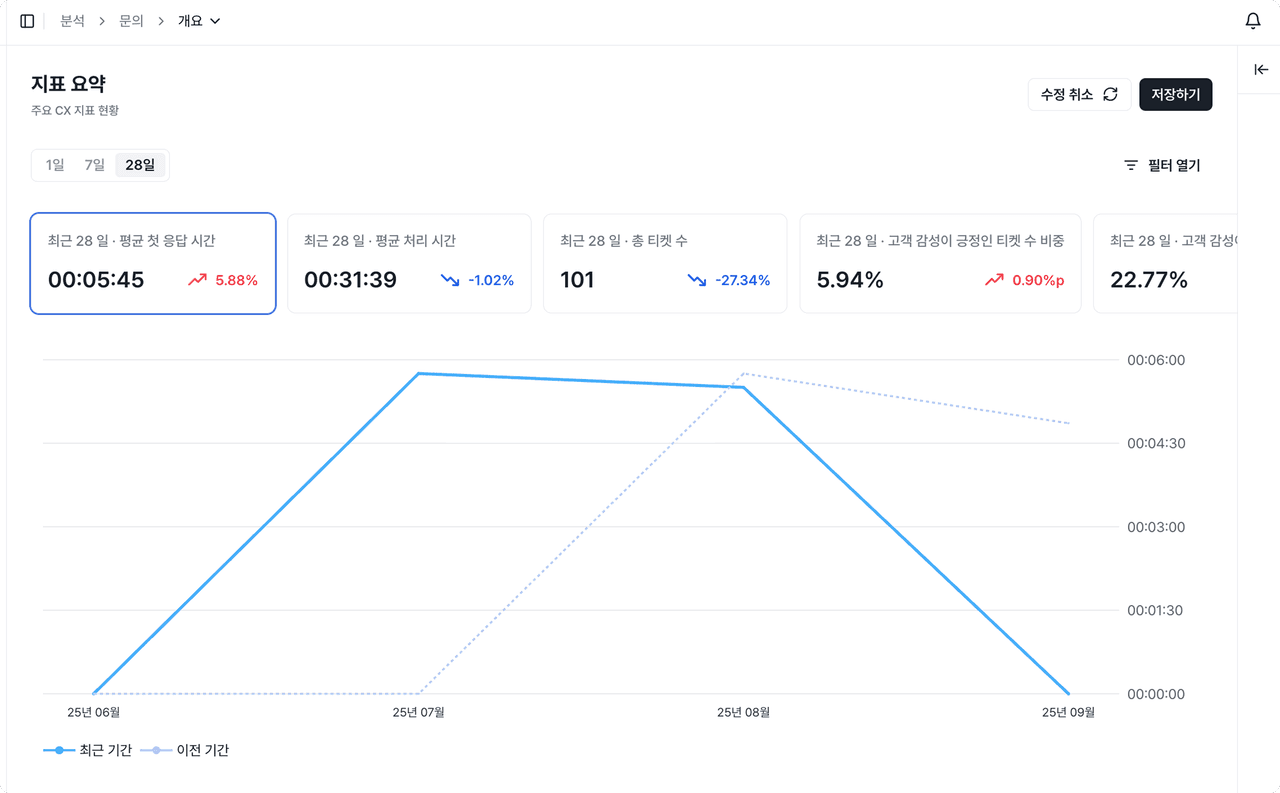
In the [Overview Dashboard], you can check the metrics and rankings you review often at a glance. You can see the values, rates of change, and trends of key metrics in real time, and by analyzing rankings based on properties and keywords, you can quickly identify spiking problems or topics that need a response.
Example use cases
When you want to track key metrics every day to catch warning signs early
- You can check core metric values on a daily basis and track the rate of change compared to the previous day.
- You can catch changes such as sudden spikes or drops early and respond quickly.
When you want to quickly grasp the top rankings by property or by keyword
- You can aggregate data by channel, category, and keyword to check rankings.
- You can quickly judge which issues or topics are occurring most often and which areas need focused management.
When you want to identify spiking issues or trends in real time and respond immediately
- Through keyword-based ranking analysis, you can monitor whether a specific topic or VOC has spiked in a short period.
- You can act right away without missing problems that urgently need a response.
How to use it
Click the [+] icon in the upper left to create an overview dashboard. When you select the key metrics and rankings, they are automatically reflected in the dashboard.
- Chart: Visualizes how a metric value (Y-axis) changes over time (X-axis)
- Table: Lets you compare metrics by property and by keyword in detail, based on time intervals
When a single metric is not enough to grasp all the data, you can split the data by property and keyword for deeper analysis. You can also use filters to set conditions for date, property, and keyword, so you can precisely analyze only the data range you want.