Update: Chart Analysis Agent
This update adds the Chart Analysis Agent.
When you press the agent analysis button added to a chart, an analysis conversation screen opens in the right panel, and the context of the chart you are viewing—its title, period, filters, and metrics—is passed automatically as the first message. You can keep asking your questions while leaving the chart as it is.
Why this matters
When you spot a trend or a notable value in a chart, you want to dig deeper into the cause right there. If the analysis screen and the conversational agent are separated, you have to verbally re-explain the period and filters you were viewing in the chart, or move data around to form your question. In the meantime, the context of the question you first had can easily fade.
This update narrows that gap so you can ask the agent right away, with the same context you were viewing in the chart.
Agent analysis you open straight from the chart
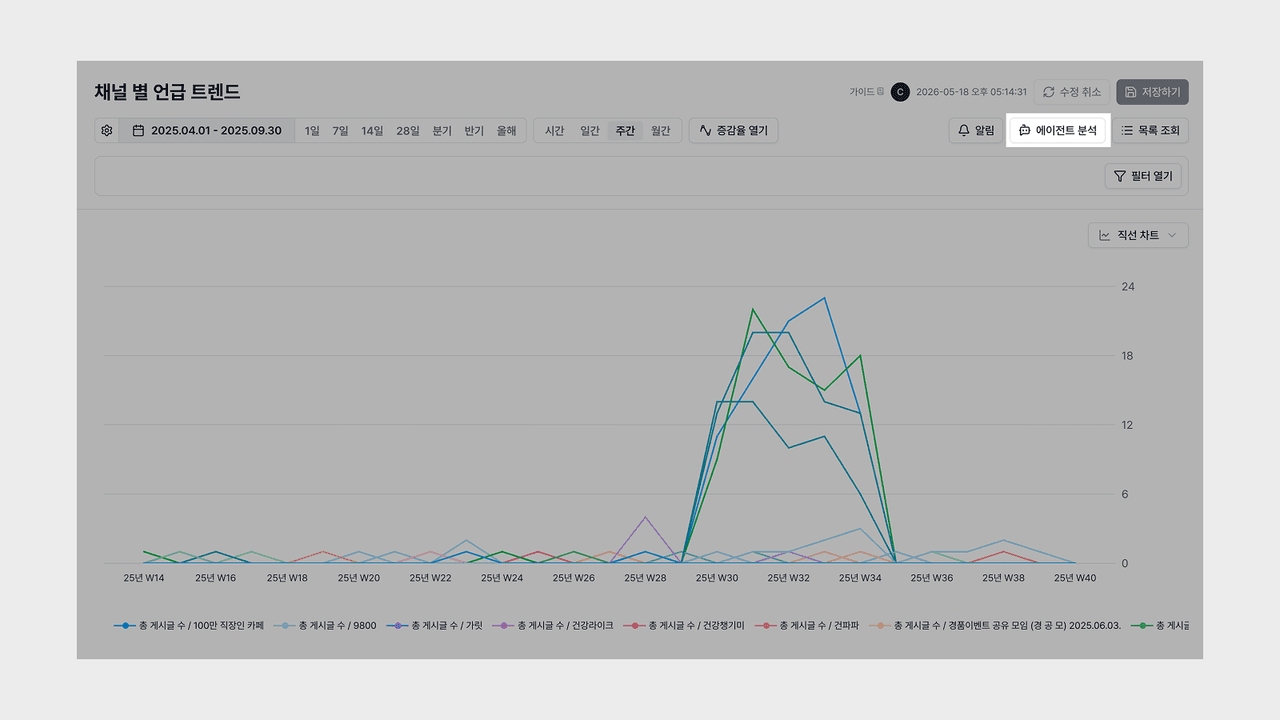
Every chart now has an entry point for agent analysis.
- One button: Press agent analysis on the chart and the right panel opens to start the analysis conversation right away.
- Stay on the screen: Exchange questions and answers on the same screen without leaving the chart you were viewing.
- Supports all charts: You can open agent analysis the same way regardless of the chart type.
Now you can dig straight into a change you noticed in a chart, right where you are.
Automatic chart context
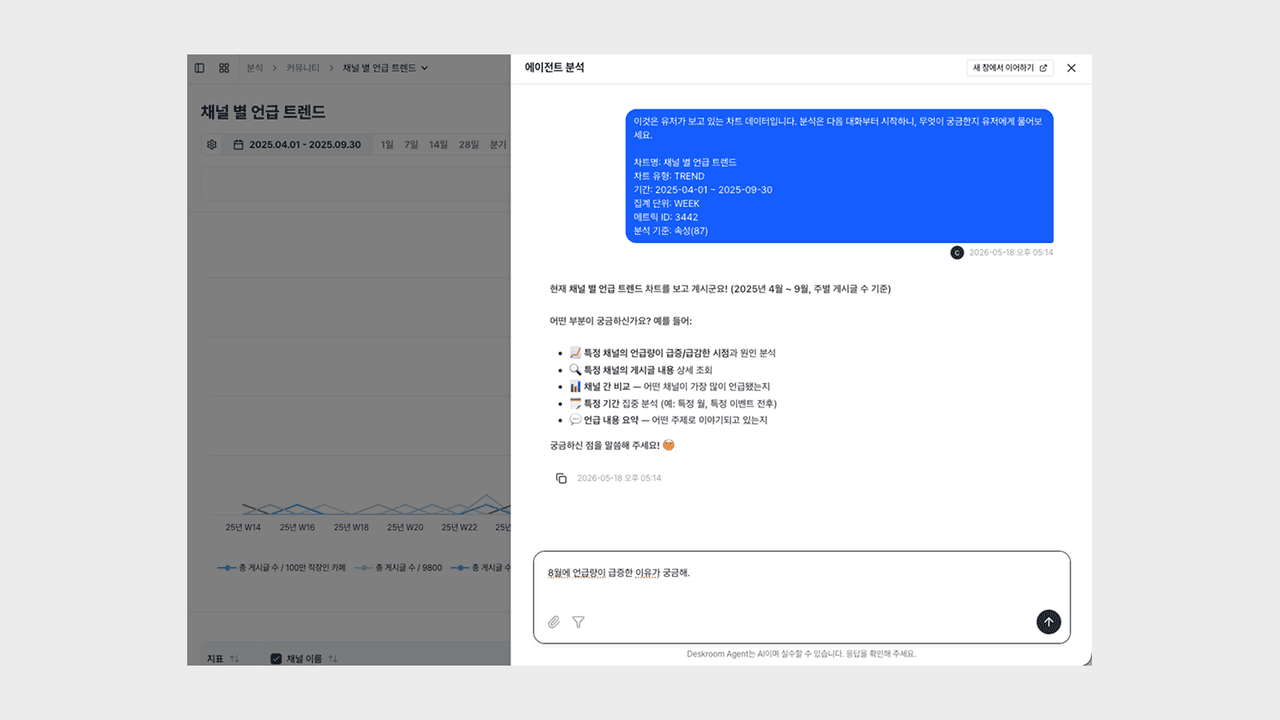
When the panel opens, the context of the chart you are viewing is passed automatically as the first message.
- Automatic context delivery: The chart title, period, applied filters, metrics, and analysis criteria are included together in the first message.
- Continue the conversation: You can keep asking follow-up questions on top of the automatically delivered context.
- Attach materials: During the conversation, you can attach files or filter conditions to ask more specifically.
Now you can throw out questions like "Let's isolate just the segment where the trend dropped and ask about the cause," "With this filter applied, help me think through how to view the next quarter," or "Point out why the rankings of the top items changed this way," without explaining the chart again.
When you open a chart in Deskroom, you can use it right away with the agent analysis button. The time you spent reviewing a chart and reorganizing your question can now go toward making decisions with data.