Update: Freeform Dashboard
This update adds two features.
We added a dashboard where you can freely arrange multiple charts within a single screen, and a property filter section that lets you narrow down all the charts on the same screen under the same condition at once.
Why it matters
When key metrics and trend charts are scattered apart, you have to move across multiple screens to review the current status and the flow together. Even when you want to narrow several charts down under the same condition, you have to set up the filter again for each chart.
This update focuses on bringing this process into a single screen, reducing the time spent on status checks and shifting perspectives.
Dashboard
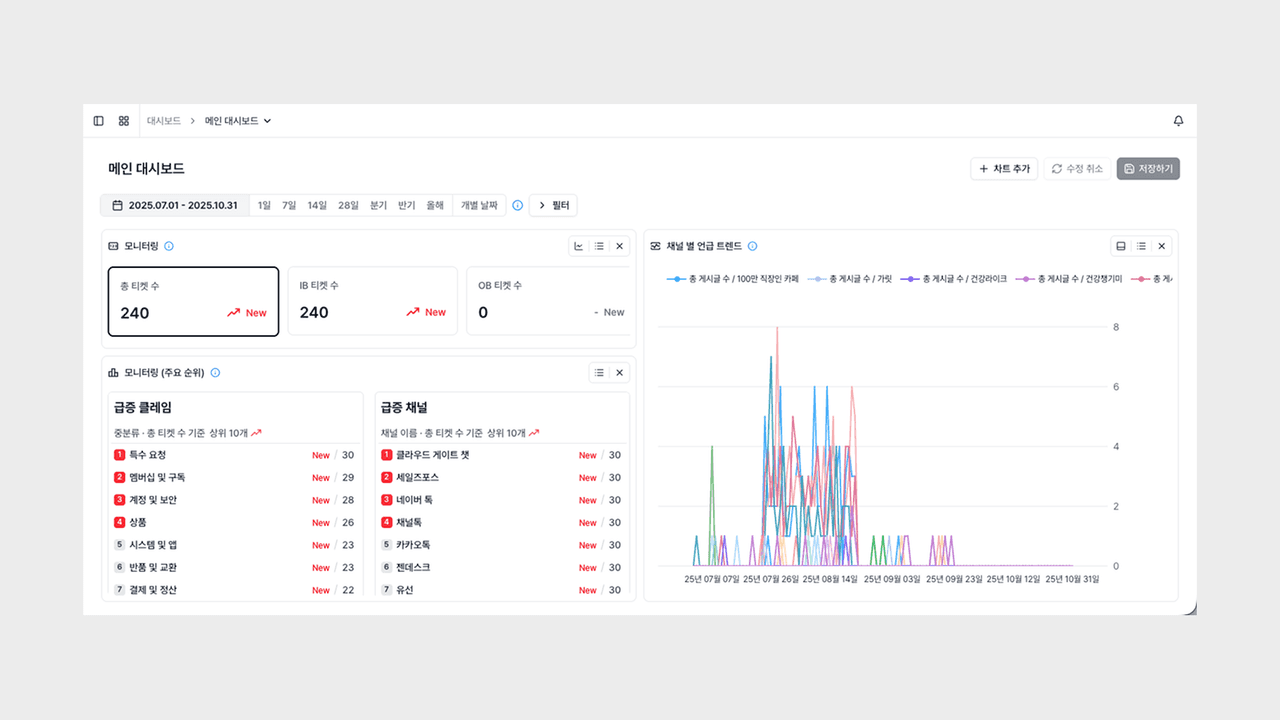
You can gather the charts you want onto one screen and freely adjust the size and position of each panel.
- Freeform arrangement: You can drag panels to compose them as you like, for example placing key metrics at the top and trend charts below.
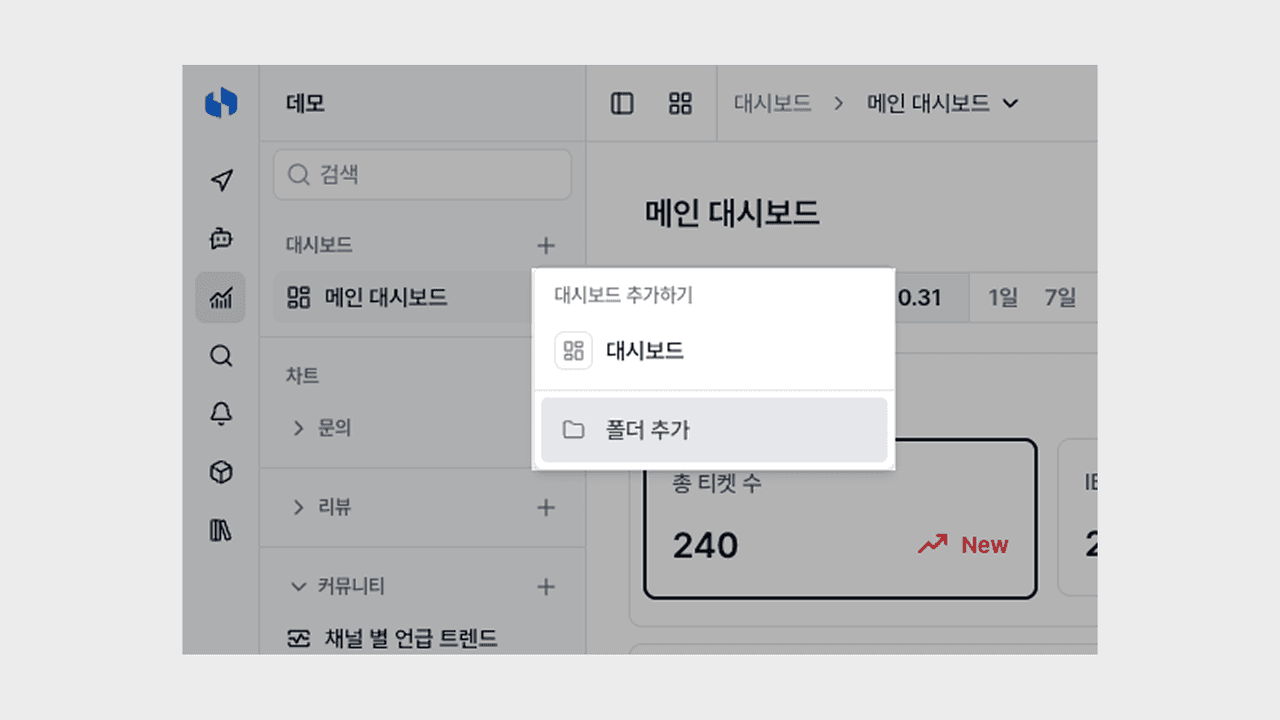
- Folder organization: You can group and manage them by topic into folders such as VOC analysis, marketing, and operations.
- Jump to detail page: Clicking a panel header takes you straight to that chart's detail page.
Now, from reviewing key metrics every morning to responding to campaigns or issues, you can compose dashboards tailored to each situation and switch between them quickly.
Dashboard property filter
By placing a property filter section at the top of the dashboard, you can narrow down the charts on the same screen under the same condition at once.
- Per-object application: A filter is additionally applied only to charts of the same object, and the filter conditions a chart originally had remain intact.
- Multiple filter sections: You can stack multiple filter sections for different objects, managing various perspectives at once on a per-screen basis.
- Quick perspective switching: You can isolate a specific channel or segment and narrow down all the charts on the same screen in bulk.
Now, without having to set up the filter again for each chart, you can change the perspective of the entire screen with a single condition change.
You can try it right away from the Deskroom sidebar > Dashboard. Gather the current status and the flow onto one screen, and make better decisions faster.