Update: Folders
As you analyze data, dashboards grow quickly over time.
The problem is that at some point it starts taking time to find the dashboard you want. When topics and purposes get mixed up, the analysis flow breaks, and in the end it becomes hard to check the metrics you need right away.
The structure for organizing dashboards is not just an arrangement; it is an important element that reflects how an organization views analysis and how it sets priorities.
This update helps you group your growing dashboards by purpose, structure them to fit your team's perspective, and access them quickly.
Dashboard folder feature
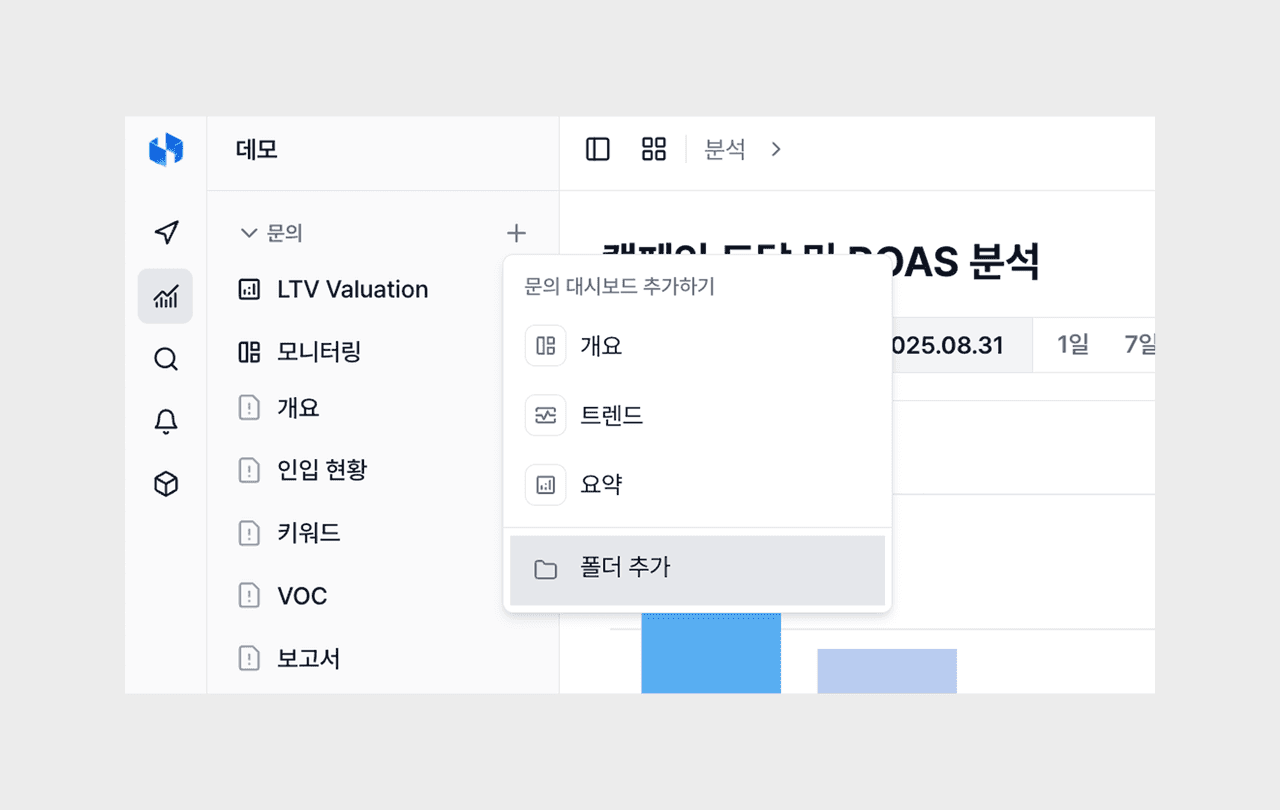
A feature for grouping and managing dashboards by folder was added.
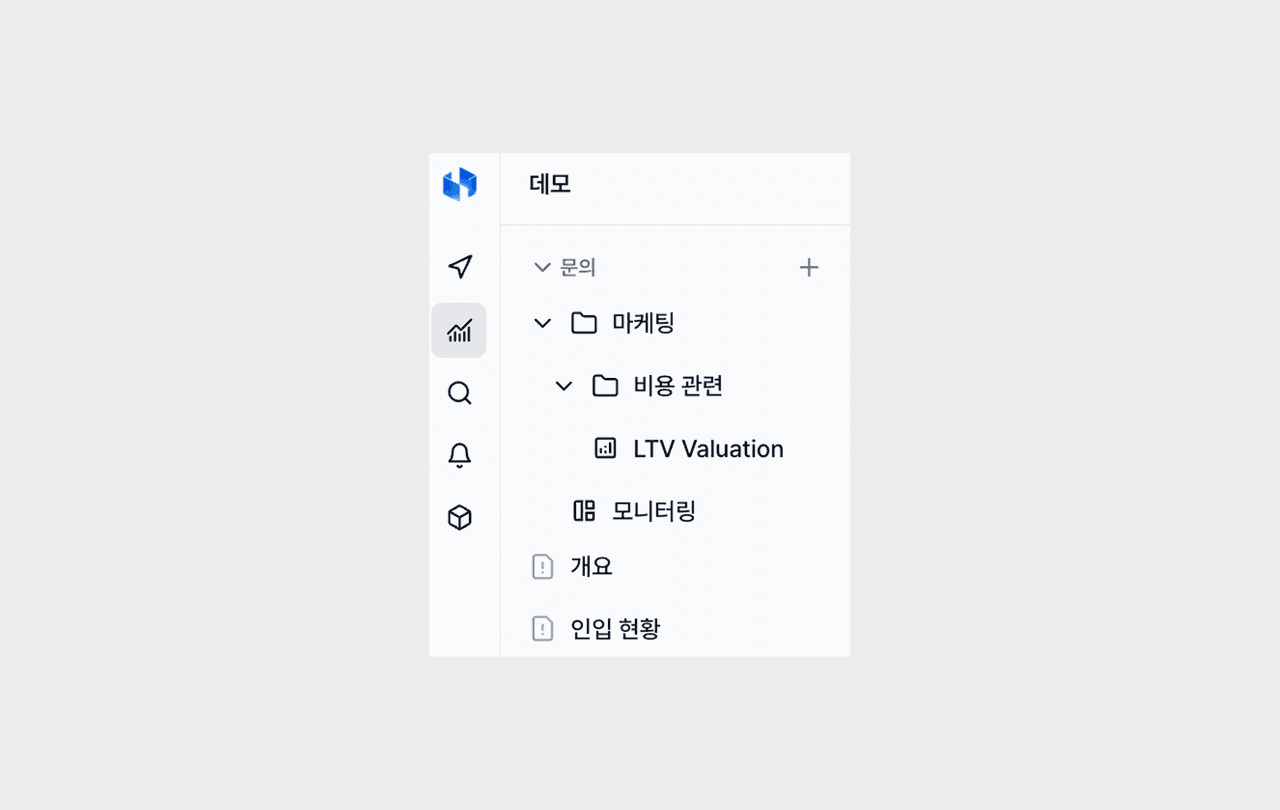
- You can divide and organize folders according to your analysis purpose or each team's perspective. For example, if you group each area into a single folder like "marketing funnel," "VOC analysis," and "operations monitoring," your analysis path becomes much simpler.
- You can add subfolders inside a folder to build a hierarchical structure. It is especially useful for large organizations or teams that run various analysis perspectives at the same time. You can create a deep structure by brand, season, metric, and so on, which makes it suitable for environments that manage many dashboards.
- A structure organized around folders can also convey a clear analysis context when sharing across teams. Even someone seeing it for the first time can easily understand what analysis can be found where, just by looking at the folder structure.
Dashboard ordering feature
You can sort individual dashboards with drag and drop.
- For dashboards used in common across an organization, it is more important to keep the order consistent at the team level. Through this feature, they are managed as a common structure shared by the whole organization.
- You can arrange dashboards according to the analysis flow the team has agreed on, so anyone can start the same analysis from the same place.
- In repeated collaboration processes such as report writing, meetings, and monitoring, confusion over "which dashboard is where" disappears, and the team's analysis criteria are naturally unified.
Small but handy updates
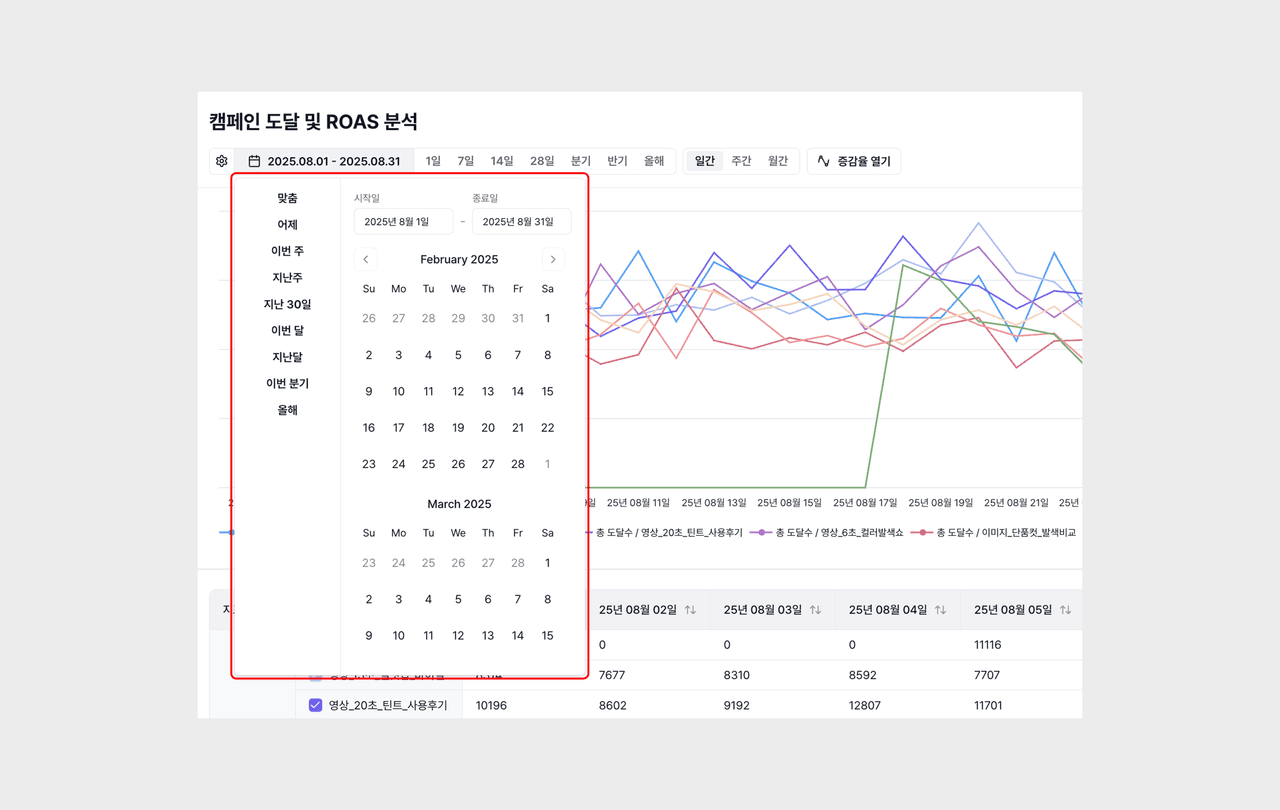
More varied date filter options
Richer date filter options are provided. You can select more granular and flexible date bases, such as monthly units, making period-based comparison and trend analysis much easier.