Custom Metrics

Deskroom now offers custom metrics so that every organization can analyze the metrics it cares about in detail.
By setting the conditions, channels, and types that differ for each organization, you can compose exactly the metrics you want.
Why we made this
Sometimes you want to view a metric by combining several conditions.
For example, you might want to know the ratio of "the number of tickets among hostile inquiries where the agent's first response time was within 5 minutes" divided by "the total number of hostile inquiries." Or you might need to see the ratio of "the number of tickets that closed with negative sentiment among tickets containing a specific keyword" divided by "the number of tickets containing that keyword."
Deskroom provides custom metrics so that anyone can create a custom metric with just a few clicks.
Example use cases
Comparing response rates by channel
You can check the share of tickets received via KakaoTalk that were actually handled by an agent.
For example, you calculate the response rate by dividing KakaoTalk channel + number of handled tickets by KakaoTalk channel + total number of tickets.
You can also add conditions to exclude chatbot-originated tickets or auto-reply tickets for more precise analysis. This helps you quickly identify channels with low response rates and build a response strategy that fits.
Tracking the trend of issues related to a specific product
You can analyze the share of tickets that contained the keyword "leakage" over the past month.
For example, you calculate the issue rate as the number of tickets containing the "leakage" keyword divided by the total number of tickets.
By viewing this value as a time series at a daily, weekly, or monthly granularity, you can see at a glance the moments when issues spiked. This is useful for catching complaints related to a product renewal, packaging change, or logistics issue early and responding to them.
Analyzing campaign effectiveness
You can analyze the average satisfaction score among inquiries that came in through the KakaoTalk channel during an event period.
By combining a specific period, a channel condition, and the CSAT score to compose a metric, you can quantitatively measure the effectiveness of a campaign.
Under the same conditions you can also analyze the response drop-off rate or the average handling time, so it can serve as a shared metric for collaboration between the marketing and CS teams.
How to use it
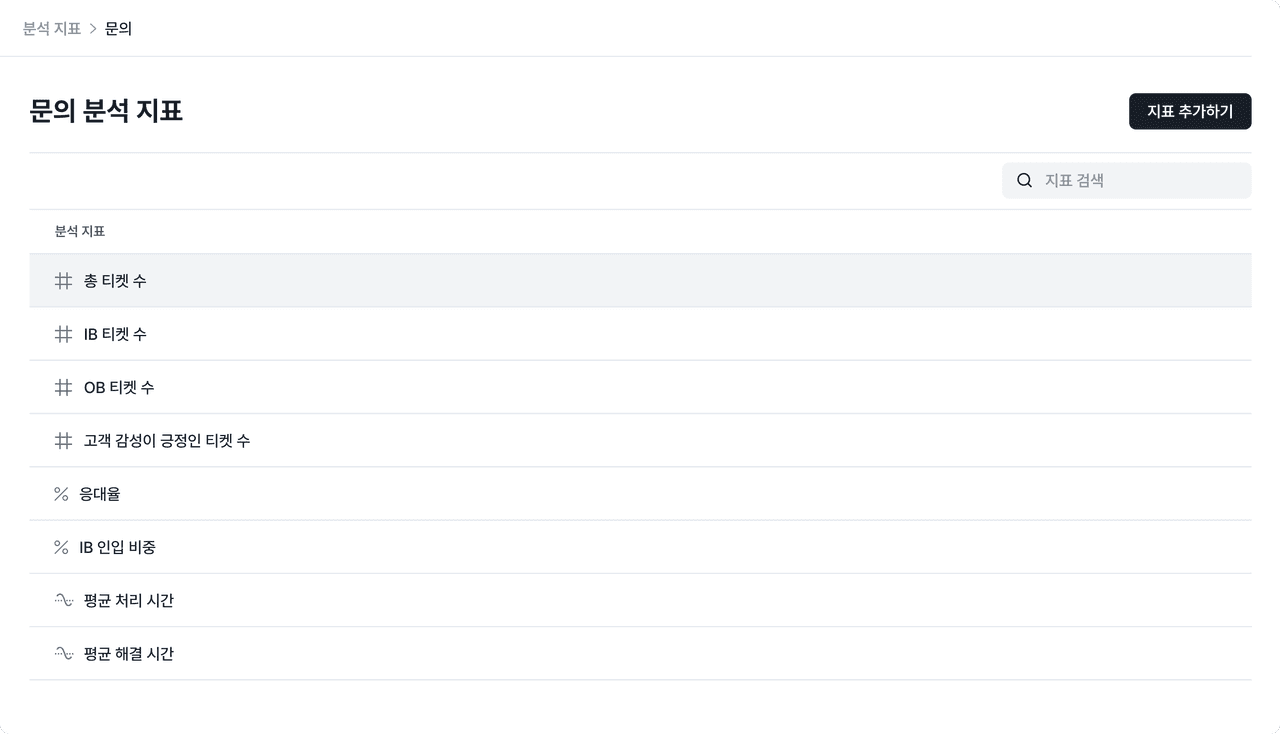
In Deskroom, go to the [Analysis Metrics] tab, where you can choose from various metric types such as sum, average, total, and ratio.
Set your conditions and compose the metric you want to see with just a few clicks. You can build a tailored metric right away, with no SQL or complex functions required.